05. Manual Vehicle Detection
Manual Vehicle Detection
Here's your chance to be a human vehicle detector! In this lesson, you will be drawing a lot of bounding boxes on vehicle positions in images. Eventually, you'll have an algorithm that's outputting bounding box positions and you'll want an easy way to plot them up over your images. So, now is a good time to get familiar with the
cv2.rectangle()
function (
documentation
) that makes it easy to draw boxes of different size, shape and color.
In this exercise, your goal is to write a function that takes as arguments an image and a list of bounding box coordinates for each car. Your function should then draw bounding boxes on a copy of the image and return that as its output.
Your output should look something like this:
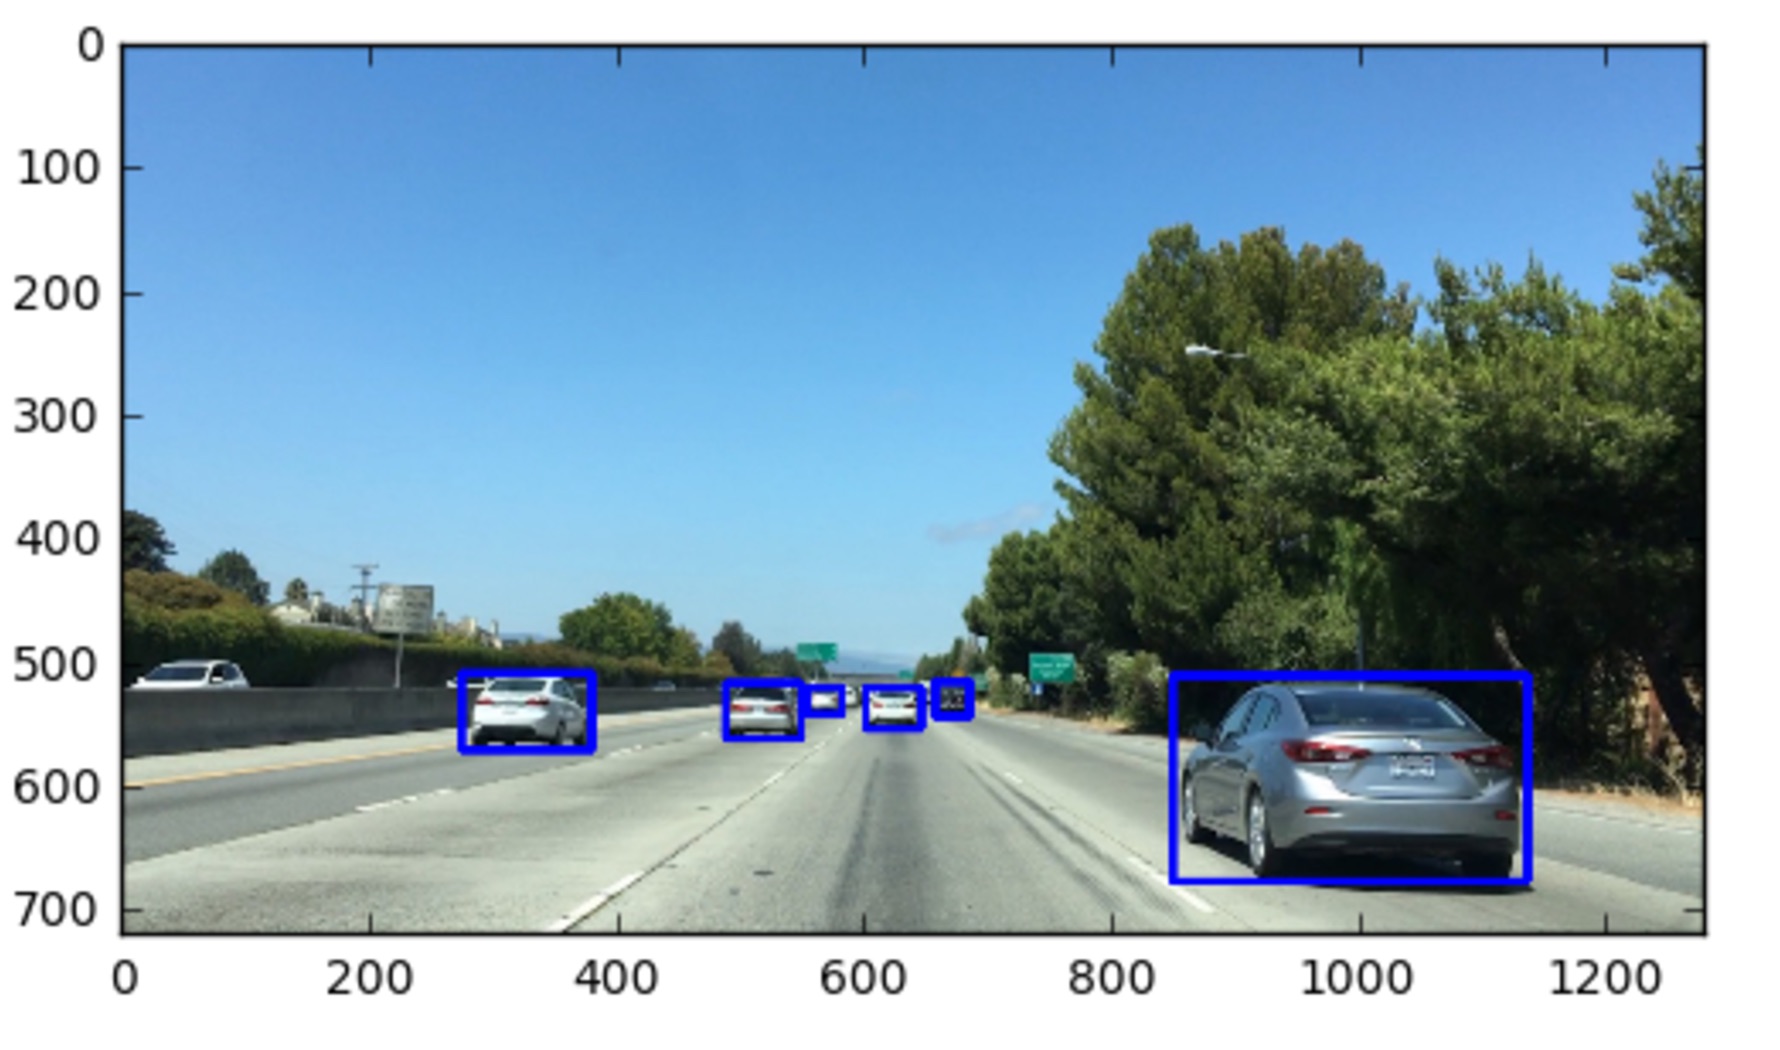
Here, I don't actually care whether you identify the same cars as I do, or that you draw the same boxes, only that your function takes the appropriate inputs and yields the appropriate output. So here's what it should look like:
# Define a function that takes an image, a list of bounding boxes,
# and optional color tuple and line thickness as inputs
# then draws boxes in that color on the output

def draw_boxes(img, bboxes, color=(0, 0, 255), thick=6):
    # make a copy of the image
    # draw each bounding box on your image copy using cv2.rectangle()
    # return the image copy with boxes drawn
You'll draw bounding boxes with
cv2.rectangle()
like this:
cv2.rectangle(image_to_draw_on, (x1, y1), (x2, y2), color, thick)
In this call to
cv2.rectangle()
your
image_to_draw_on
should be the copy of your image, then
(x1, y1)
and
(x2, y2)
are the x and y coordinates of any two opposing corners of the bounding box you want to draw.
color
is a 3-tuple, for example,
(0, 0, 255)
for blue, and
thick
is an optional integer parameter to define the box thickness.
Have a look at the image above with labeled axes, where I've drawn some bounding boxes and "guesstimate" where some of the box corners are. You should pass your bounding box positions to your
draw_boxes()
function as a list of tuple pairs, like this:
bboxes = [((x1, y1), (x2, y2)), ((,),(,)), ...]If you want to investigate the above image more closely, you can download it here .
draw_bboxes
Start Quiz: